SALES PIPELINE
101 sales statistics (2026): benchmarks across AI, B2B, funnel, enablement, and more

By Geethapriya
Last updated on Aug 3, 2026
Explore this blog to find 101 curated sales statistics, covering AI in sales, B2B deal cycles, funnel conversion benchmarks, sales enablement ROI, coaching outcomes, CRM impact, and productivity data, organised by topic so you can pull exactly the numbers your strategy needs.

- What are sales statistics?
- AI in sales statistics
- B2B sales statistics
- B2C sales statistics
- Sales funnel statistics
- Sales prospecting statistics
- Sales enablement statistics
- Sales coaching statistics
- Sales productivity statistics
- CRM and technology statistics
- Sales compensation and quota statistics
- Social selling and email statistics
- General sales trend statistics
- Sales data quality statistics
- Resources & references
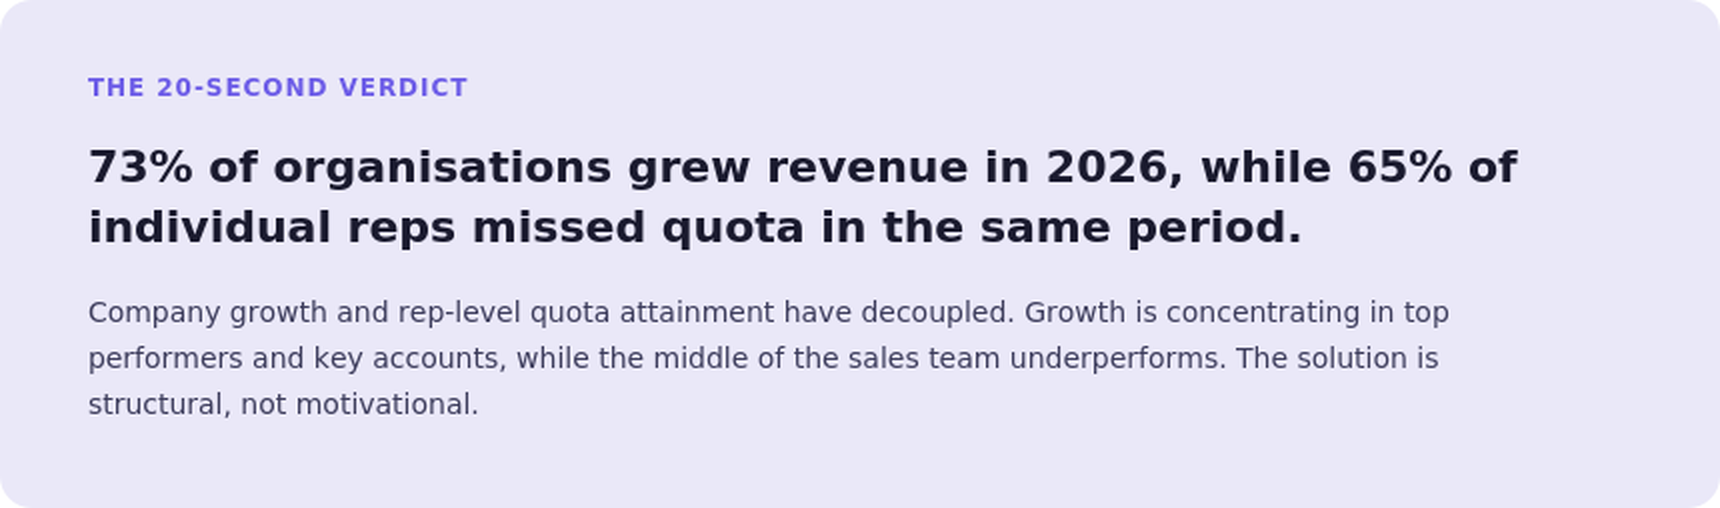
Sales data tells a story of contradictions. Salesforce's 2026 State of Sales report found that 73% of sales organisations grew revenue year-over-year, yet 65% of reps missed quota in the same period. The gap between organisational-level growth and individual-level quota attainment is the defining tension in modern selling.
This blog collects 101 verified sales statistics across ten categories: AI in sales, B2B sales, B2C sales, sales funnel conversion, prospecting, enablement, coaching, productivity, CRM, and sales compensation. Every stat is sourced from primary research, no recycled numbers without attribution.
The sections are structured so you can go directly to what you need. Each stat is numbered for easy citation.
What are sales statistics?
Sales statistics are data-backed benchmarks that measure how sales teams prospect, engage, convert, and retain customers. Sales leaders use these figures to set quotas, evaluate performance, allocate resources, and benchmark their results against industry standards. Updated annually from primary research by Salesforce, HubSpot, Gartner, RAIN Group, and LinkedIn.
AI in sales statistics
AI adoption in sales accelerated sharply between 2024 and 2026. Teams using AI tools report higher revenue attainment, shorter sales cycles, and fewer hours lost to manual data entry. The statistics below draw from Salesforce, Gartner, McKinsey, and HubSpot research.
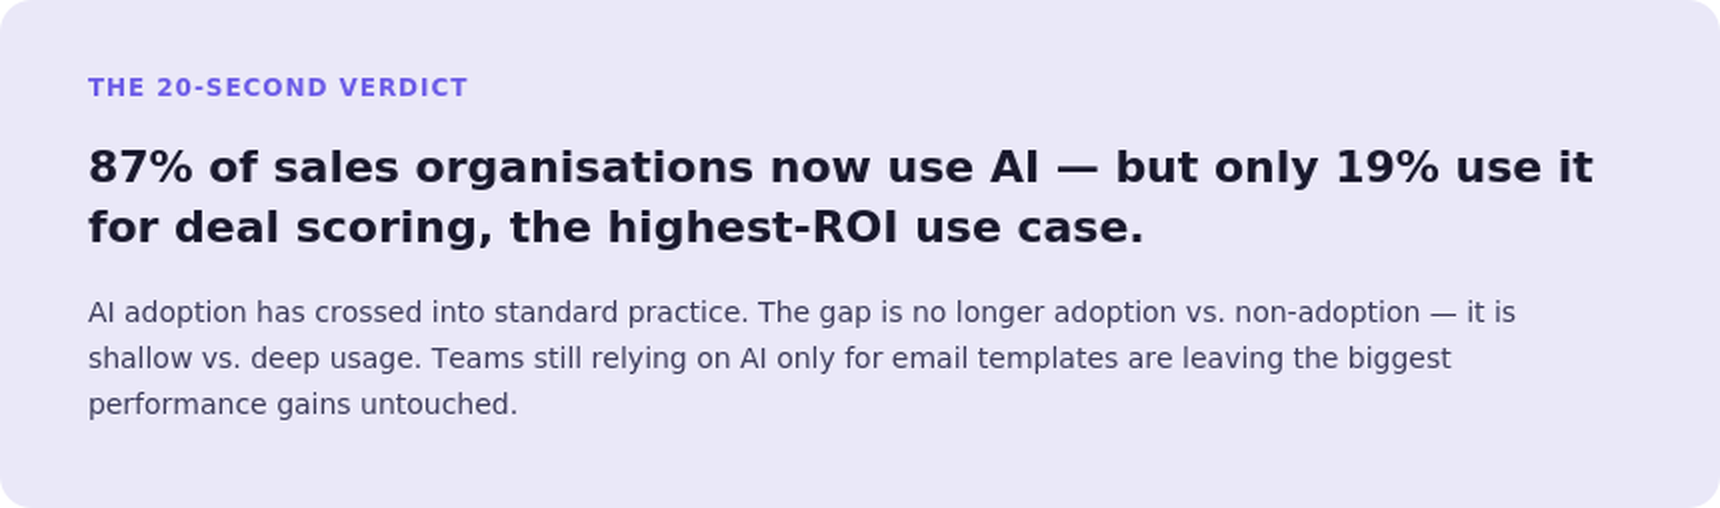
1. 87% of sales organisations now use some form of AI in their sales process. (Salesforce, State of Sales 2026)
AI adoption has crossed from early adopter to standard practice. Organisations not yet using AI tools risk a widening performance gap against competitors who are.
2. AI-assisted sellers are 1.3x more likely to hit quota than sellers without AI support. (Salesforce, State of Sales 2026)
The performance lift from AI is no longer marginal. Teams deploying AI for lead prioritisation, call summaries, and next-action suggestions consistently outperform those relying on manual workflows.
3. Sales teams using AI report a 50% reduction in time spent on administrative tasks. (McKinsey, The State of AI in Sales 2025)
The biggest productivity win from AI in sales is not outreach personalisation, it is eliminating manual CRM entry, note-taking, and activity logging that consumes selling time.

Do you benchmark your sales performance against industry trends?
4. 69% of sales professionals say AI tools help them spend more time building customer relationships. (Salesforce, State of Sales 2026)
The concern that AI replaces human connection is not supported by the data. Sellers using AI report more, not less, time for high-value customer conversations.
5. Organisations using AI for lead scoring see a 30% improvement in sales-qualified lead conversion rates. (Gartner, Sales Technology Adoption Report 2025)
AI-based ICP scoring and intent signals allow sales teams to prioritise deals most likely to close, reducing time wasted on low-fit accounts.
6. Sales reps who use AI-generated call summaries save an average of 2.5 hours per week. (HubSpot, Sales Trends Report 2026)
Meeting intelligence tools that auto-generate summaries, pull action items, and log outcomes directly to CRM are the most time-saving AI use cases for field reps.
7. Companies using AI to detect competitor mentions in sales calls are 2x more likely to adjust their pitch before the next stakeholder meeting. (Gong Labs, Revenue Intelligence Report 2025)
Conversation intelligence that surfaces competitive signals during live deals is one of the least-used but highest-impact AI capabilities in the current market.
8. Only 19% of sales teams currently use AI for predictive deal scoring despite it being the highest-ROI AI use case. (SPOTIO, State of Field Sales 2026)
Most AI adoption in sales clusters around entry-level use cases: email personalisation and call summaries. Predictive analytics and deal scoring — which drive the most measurable revenue impact- remain underutilised.
9. AI-powered personalised outreach sequences generate 3x higher reply rates than manually written templates. (SalesLoft, State of Sales Engagement 2025)
The lift comes from dynamic personalisation using prospect intent data, recent company news, and ICP fit signals — not just name-swapping in a template.
10. 74% of B2B buyers say they are more likely to engage with a vendor whose outreach demonstrates awareness of their specific business situation. (Gartner, B2B Buyer Behaviour Report 2025)
AI-driven personalisation at scale directly addresses the most common buyer complaint about outbound sales: generic messaging that ignores context.
B2B sales statistics
B2B selling has grown structurally more complex. Buying committees are larger, deal cycles are longer, and the average B2B purchase now involves more stakeholders with divergent priorities. These statistics cover deal cycles, buyer behaviour, quota performance, and the gap between leadership expectations and rep experience.
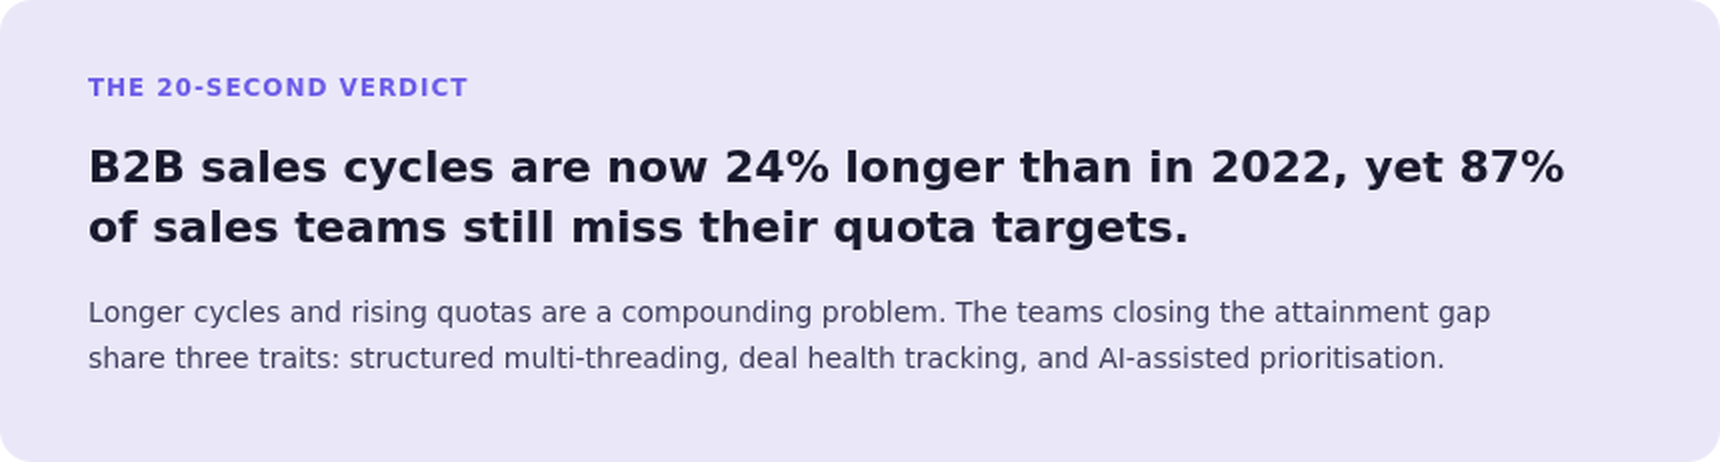
11. The average B2B sales cycle increased 24% between 2022 and 2024 — from 60 to 75 days. (Salesforce, State of Sales 2024)
Longer cycles increase cost-of-sale and create more opportunities for deals to stall. Teams without deal-health tracking miss deterioration signals until it is too late to recover.
12. B2B buying committees now average 6–10 stakeholders for enterprise decisions, up from 3–4 a decade ago. (Gartner, The New B2B Buying Journey 2024)
Multi-threaded selling is no longer optional. Deals with only one internal champion have a significantly higher risk of being killed by an unseen blocker.
13. 77% of B2B buyers say their last purchase was very complex or difficult. (Gartner, B2B Buyer Behaviour Report 2025)
Buyer-side complexity is driving longer evaluation windows and more internal consensus-building, creating more touchpoints where a deal can stall or die.
14. Only 17% of a B2B buyer's total purchase journey is spent meeting with potential suppliers. (Gartner, The New B2B Buying Journey 2024)
Buyers do the majority of their research independently. Sales reps who fail to influence the self-directed research phase, through content, peer reviews, and digital touchpoints, have already lost ground before the first call.
15. B2B deals with 4 or more engaged stakeholders close at a 31% higher rate than single-threaded deals. (Gong Labs, Revenue Intelligence Report 2025)
Multi-threading is directly correlated with win rate. Identifying and engaging the buying committee early is one of the highest-leverage activities in enterprise B2B selling.
16. 87% of sales teams fail to meet or exceed their annual quota targets. (SPOTIO, State of Field Sales 2026)
Quota attainment has become the exception, not the rule. Organisations that close this gap consistently share a common profile: shorter ramp times, structured coaching, and AI-assisted prioritisation.
17. 57% of B2B reps missed quota in Q2 2025. (RepVue, Q2 2025 Sales Index)
The quota miss rate is not a one-quarter anomaly. It has been a persistent trend since 2022, driven by rising quotas, longer cycles, and smaller average deal sizes in inflationary conditions.
18. Top-performing B2B sellers are 51% more likely to inspire buyer confidence that results will be achieved. (RAIN Group, Top Performance in Sales Prospecting 2025)
The differentiation between top and average performers is not product knowledge; it is the ability to credibly communicate a path to the buyer's desired outcome.
19. B2B companies using partner-channel strategies report 15% higher growth than direct-only peers. (Salesforce, State of Sales 2026)
Channel expansion is becoming a structural advantage, not just a supplementary revenue stream, for B2B organisations scaling beyond their direct team capacity.
20. Sales cycle length was reduced by 25% in B2B companies that adopted digital channel strategies between 2023 and 2024. (Gartner, B2B Digital Commerce Benchmark 2024)
Digital-first buyer engagement, product demos, self-serve trials, and async video compress the evaluation phase and reduce the number of synchronous selling touchpoints required to close.
B2C sales statistics
B2C sales environments move faster and are more sensitive to experience quality, trust signals, and channel preferences. These statistics cover consumer buying behaviour, repeat purchase drivers, digital channel performance, and the gap between seller practices and consumer expectations.
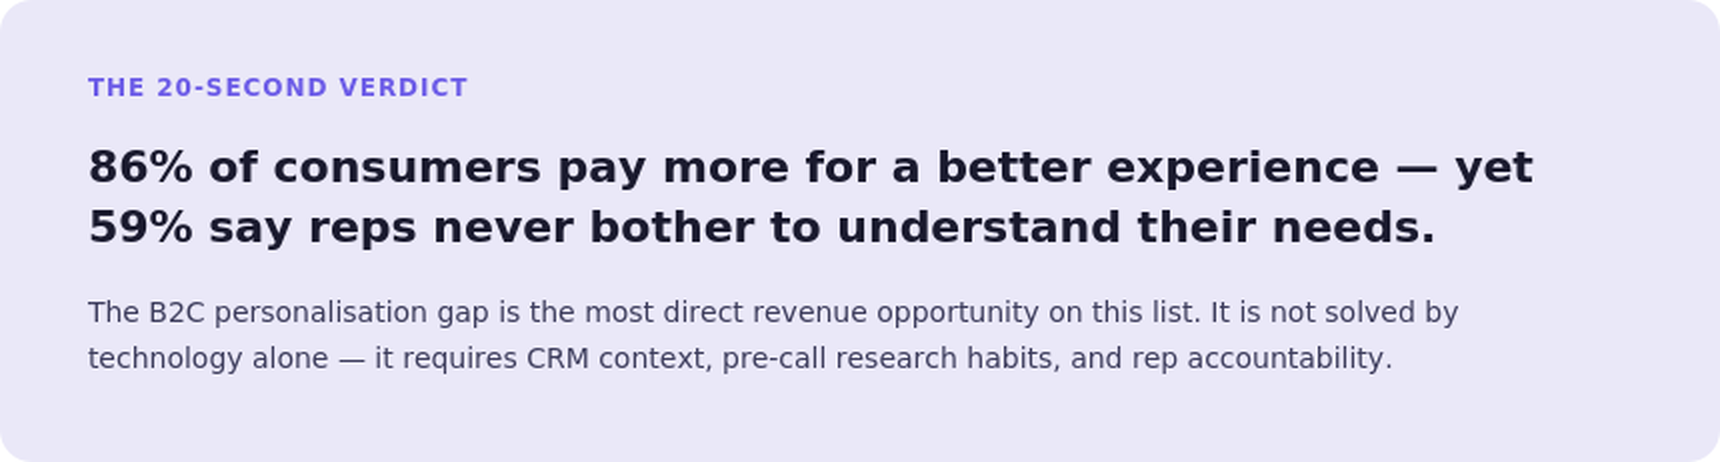
21. 86% of consumers are willing to pay more for a better customer experience. (PwC, Future of Customer Experience Survey 2025)
Experience is now a pricing lever, not just a retention tool. B2C teams that invest in reducing friction at every touchpoint have a measurable advantage in both conversion and margin.
22. 32% of customers will stop doing business with a brand after just one bad experience. (PwC, Future of Customer Experience Survey 2025)
The tolerance window for friction has narrowed. A single poor interaction, a failed follow-up, a slow response, a misaligned pitch, can end a commercial relationship that took months to build.
23. 86% of buyers are more likely to purchase again from a company they trust. (HubSpot, State of Sales 2025)
Trust is the highest-return investment in B2C sales. It is built through consistency, transparency about pricing and terms, and responsive post-sale service, not just the initial purchase experience.
24. Subscription-based B2C models are projected to reach USD 1.5 trillion by the end of 2025 — a 435% increase in nine years. (UBS, Global Subscription Economy Report 2025)
Recurring revenue models have moved from a digital-native novelty to the dominant commercial structure across retail, media, software, and services. Teams selling subscriptions must optimise for lifetime value, not just initial conversion.
25. 75% of direct-to-consumer businesses will offer subscription options by the end of 2026. (Zuora, Subscription Economy Index 2026)
The shift to subscriptions changes the economics of B2C selling: average contract value drops while customer lifetime value rises. Churn prevention becomes as important as acquisition.
26. Top-performing B2C field sales teams are 1.5x more likely to operate with sub-4-week sales cycles. (SPOTIO, State of Field Sales 2026)
Speed is a competitive advantage in B2C selling. Short cycles mean more feedback loops per quarter, faster adjustment, and compounding wins over slower-moving competitors.
27. Non-store and online B2C sales are projected to grow 7–9% in 2026, outpacing total retail growth of 2.7–3.7%. (National Retail Federation, 2026 Retail Outlook)
Digital channels are taking an increasing share of B2C revenue. Sales teams that have not built digital prospecting and conversion capabilities are losing ground to those that have.
28. 59% of consumers feel that sales reps do not take the time to understand their needs. (Salesforce, State of the Connected Customer 2025)
The personalisation gap between what buyers expect and what sellers deliver is widest in B2C. This is directly addressable through pre-call research, behavioural data, and CRM context, not just instinct.
Sales funnel statistics
Funnel conversion benchmarks tell you where deals are being lost, and at which stage intervention has the highest return. These statistics cover conversion rates at each funnel stage, the cost of funnel neglect, and lead nurturing performance data.
29. The average sales close rate across industries sits at approximately 20%. (HubSpot, State of Sales 2025)
A 20% close rate means 80% of the pipeline never converts. The question is whether that attrition is spread evenly across the funnel or concentrated at a specific stage, which determines where investment in process improvement has the highest return.
30. Software companies achieve average close rates of 22%; biotech firms average approximately 15%. (HubSpot, State of Sales 2025)
Close rates vary significantly by industry and deal complexity. Benchmarking against sector-specific data gives a more accurate picture of performance gaps than using a blended average.
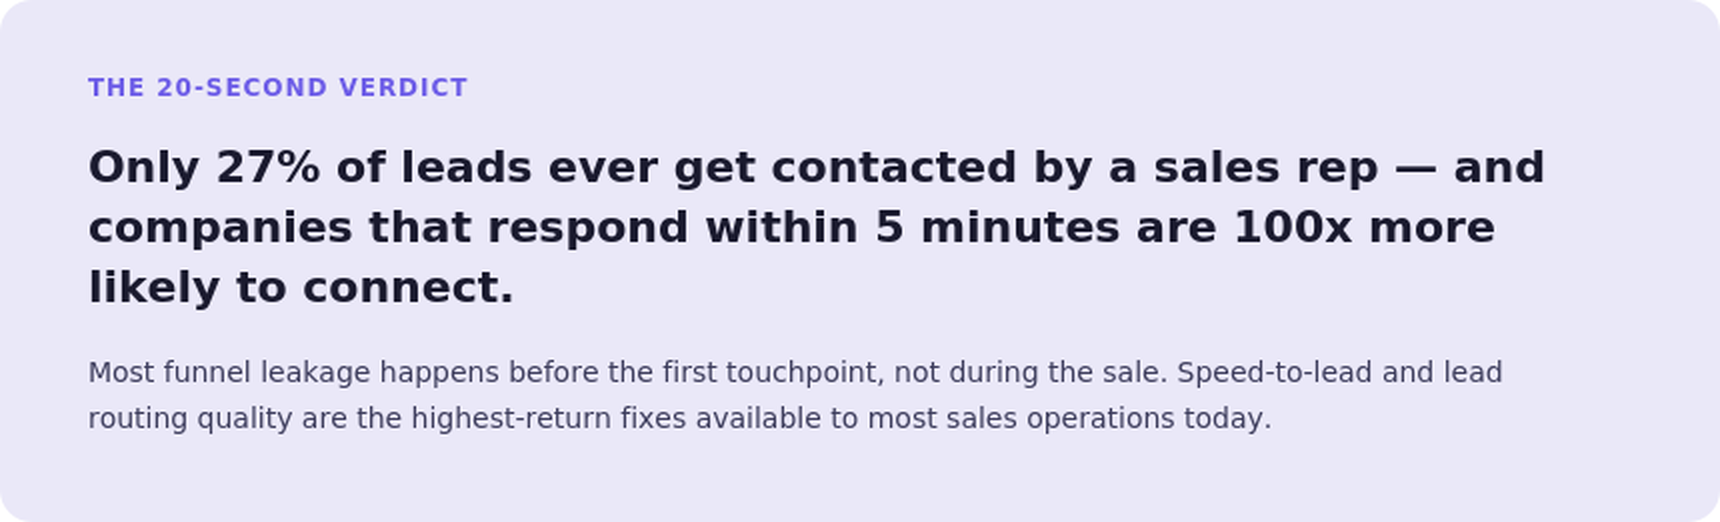
31. Only 27% of leads ever get contacted by a sales rep. (MarketingSherpa, Lead Generation Benchmark Report 2025)
More than two-thirds of leads decay without a single touchpoint. The cause is typically poor lead routing, insufficient rep capacity, or the absence of automated qualification to prioritise which leads receive immediate follow-up.
32. Companies that contact a lead within 5 minutes of enquiry are 100x more likely to connect with that prospect. (InsideSales.com / Velocify, Lead Response Management Study)
Speed-to-lead is one of the most significant and consistently under-prioritised funnel levers. The probability of a meaningful conversation drops sharply after the first 30 minutes post-enquiry.
33. Nurtured leads produce 20% more sales opportunities than non-nurtured leads. (Forrester Research, Lead Nurturing Benchmark 2024)
Most pipeline attrition happens to leads that were not yet ready to buy when first contacted. A structured nurture sequence keeps SparrowCRM in consideration during the buyer's self-directed evaluation phase.
34. Companies with strong lead nurturing generate 50% more sales-ready leads at 33% lower cost. (Forrester Research, Lead Nurturing Benchmark 2024)
The economics of nurture are compelling: more pipeline, at lower cost-per-opportunity. The barrier is typically the absence of a structured sequence and a CRM that tracks the nurture stage.
35. 80% of prospects who are not ready to buy today will be ready within 24 months. (Gleanster Research, cited in MarketingProfs 2024)
A pipeline that disappears from a short-term forecast does not disappear from the market. Long-term nurture programmes capture revenue from leads that surface-level funnel analysis would classify as lost.
36. Sales cycles have grown 24% longer since 2022, increasing average opportunity cost per deal. (Salesforce, State of Sales 2024)
Longer cycles increase the cost of carrying a deal through the funnel. Accurate funnel-stage tracking and deal health scoring allow teams to identify at-risk deals before time investment becomes unrecoverable.
37. Tuesdays show win rates 20% higher than the weekly average; morning contacts (9–10 AM) outperform afternoon by 45%. (HubSpot, Sales Statistics Report 2025)
Timing within the funnel matters. Structuring high-stakes calls and closing conversations on high-performance days and times is a simple, zero-cost optimisation most teams do not apply.
38. Deals with mutual action plans close at a 43% higher rate than those without. (Gong Labs, Revenue Intelligence Report 2025)
A mutual action plan, a shared document outlining agreed next steps, decision timelines, and stakeholder responsibilities, creates accountability on the buyer side and reduces late-stage stall.
Sales prospecting statistics
Prospecting is consistently rated the hardest part of the sales job, and the data supports why. Channel saturation, buyer defensiveness, and misaligned timing make the top of the funnel the most resource-intensive stage to operate.
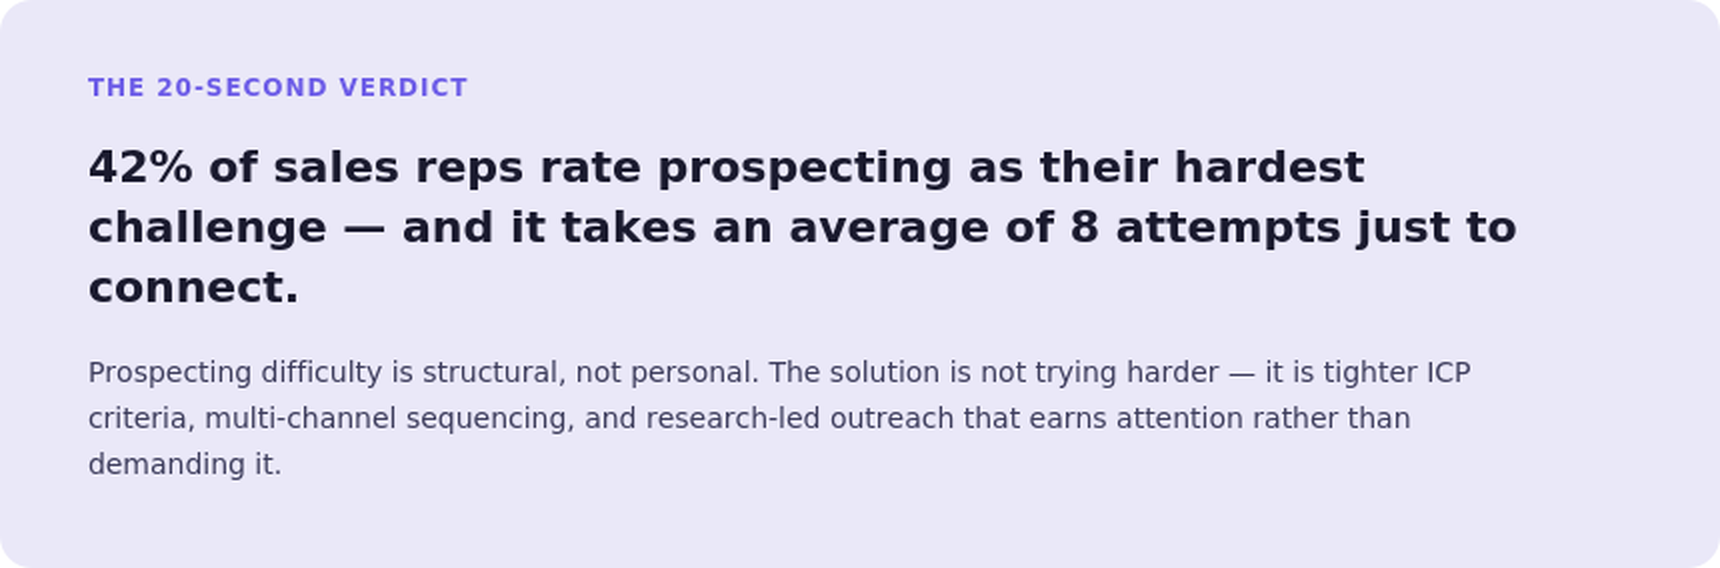
39. 42% of salespeople rate prospecting as the most difficult part of their role, harder than closing or qualifying. (HubSpot, State of Sales 2025)
The difficulty of prospecting is structural, not skill-based. It reflects the combination of buyer attention scarcity, channel saturation, and the absence of clear ICP criteria that would reduce the pool of targets to a manageable, high-fit list.
40. Email remains the preferred outreach channel for 80% of prospects. (HubSpot, State of Sales 2025)
Email's dominance as a buyer-preferred channel persists despite inbox saturation. The differentiator is not the channel; it is relevance, timing, and personalisation quality.
41. 57% of C-suite buyers prefer phone calls; only 37% of reps close deals through cold calling. (LinkedIn, State of Sales Report 2025)
Channel preference varies sharply by buyer seniority. Executive-level prospects remain more reachable by phone than by email, yet most outreach strategies are email-dominant.
42. Sales reps require approximately 8 attempts to connect with a prospect. (TeleSmart Communications, cited in HubSpot 2025)
The persistence gap is large. Most reps stop after 1–2 attempts. The data shows connection requires a sustained multi-touch effort across several days.
43. Only 2% of cold calls result in a booked appointment. (Leap Job, Cold Calling Research 2024)
The low conversion rate of cold calling does not make it redundant; it makes volume and qualification criteria critical. A well-targeted cold calling list at 2% conversion is a viable pipeline source; an untargeted list at 2% is a resource drain.
44. Prospects are most reachable at 11 AM–12 PM and 4–5 PM local time; Tuesdays produce the highest connection rates. (InsideSales.com, Lead Response Management Study)
Call timing optimisation is one of the few zero-cost improvements available to most prospecting programmes. Shifting outbound calling to peak-response windows measurably improves connect rates.
45. Successful cold calls last an average of 5 minutes 50 seconds, nearly twice the duration of unsuccessful ones. (Gong Labs, Revenue Intelligence Report 2025)
Call duration is a reliable proxy for engagement quality. A rep who holds attention for six minutes is having a conversation, not delivering a pitch. Discovery questions that open a genuine dialogue are the differentiator.
46. 82% of top-performing sales reps research a prospect before making contact; only 49% of average performers do the same. (LinkedIn, State of Sales Report 2025)
Research before outreach is the single most consistent differentiator between top and average performers in prospecting. It takes 10 minutes, and the data shows it is the step most skipped.
Sales enablement statistics
Sales enablement, the practice of giving reps the content, tools, and training they need to engage buyers effectively, has moved from a nice-to-have to a measurable competitive differentiator. These benchmarks cover win rates, onboarding, content usage, and ROI.
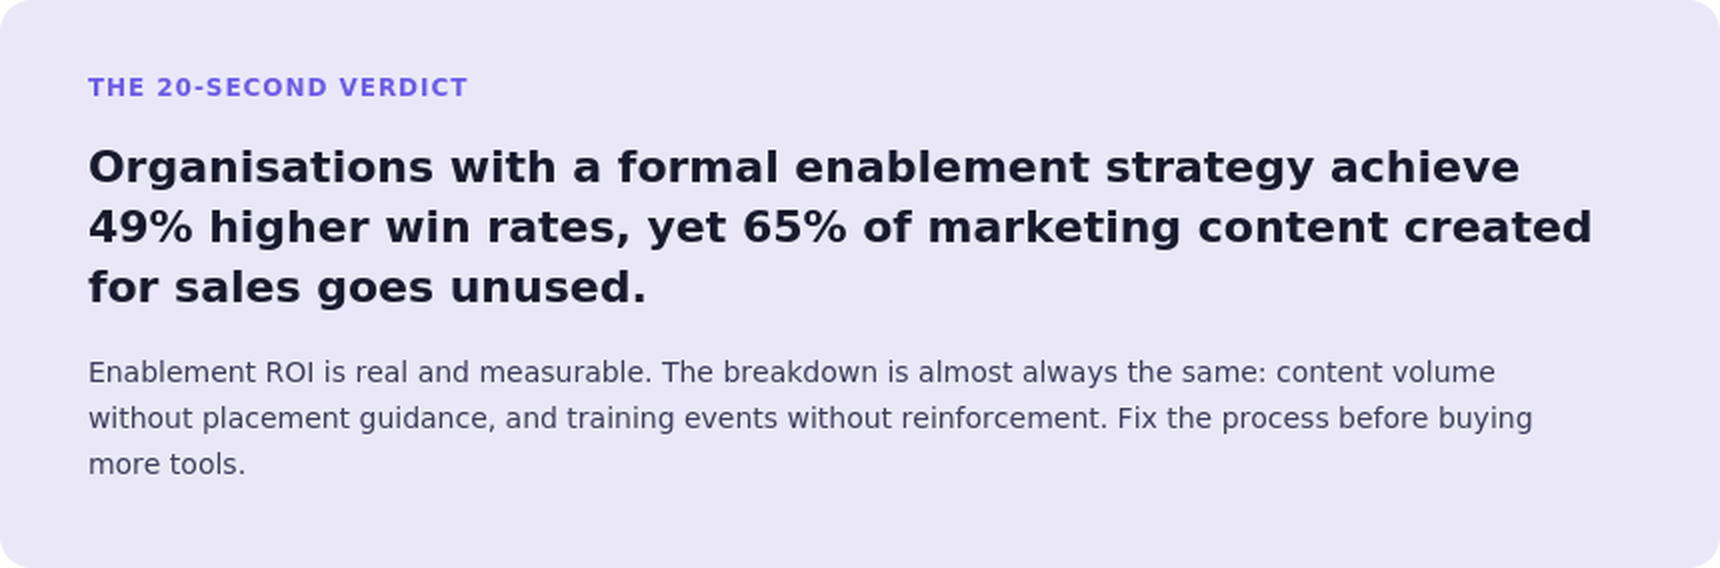
47. Organisations with a formal sales enablement strategy achieve 49% higher win rates on forecasted deals. (CSO Insights, Sales Enablement Report 2025)
The win rate gap between organisations with and without structured enablement is the single most compelling argument for investing in the function. A 49% lift in forecast accuracy affects revenue predictability across the entire organisation.
48. Companies with dedicated sales enablement programmes see a 15% improvement in win rates and a 27% reduction in sales cycle length. (Aberdeen Group, Sales Enablement Benchmark 2024)
Enablement impacts two of the most expensive metrics in the sales operation simultaneously: the percentage of deals that close and the time it takes to close them.
49. Sales reps spend 43% of their time looking for or creating content rather than selling. (Forrester Research, Sales Productivity Report 2024)
Content sprawl is one of the most underestimated productivity drains in sales. When reps cannot find the right collateral quickly, they either build it themselves or skip it, both of which reduce selling time and content quality.
50. 65% of content created by marketing for sales goes unused by sales reps. (Sirius Decisions, State of Sales Enablement 2024)
The most common failure mode of enablement is a production-volume approach to content without alignment to where and how reps actually use it in the sales conversation.
51. Buyers who receive relevant content from sales reps at each stage of their journey are 3x more likely to make a larger purchase. (Forrester Research, B2B Buyer Behaviour 2024)
Content relevance, the right asset at the right stage, has a direct impact on deal size, not just conversion. This justifies investment in content mapping and rep coaching on when to deploy specific assets.
52. Organisations with aligned sales and marketing enablement see 38% higher sales win rates and 36% higher customer retention. (MarketingProfs, State of Sales and Marketing Alignment 2025)
Enablement is a two-function investment. The highest-performing enablement programmes are joint operations between sales and marketing, not a sales function bolted onto a marketing content library.
53. Companies that invest in sales enablement technology see a 10–15% revenue increase within 12 months of deployment. (Gartner, Sales Technology ROI Study 2025)
Technology alone does not deliver the result; adoption and process alignment do. The 10–15% figure represents organisations that deployed enablement tools with structured change management, not those that issued licences without a rollout plan.
Sales coaching statistics
Sales coaching is the highest-leverage management activity in the sales operation, and the most consistently under-invested. The statistics below quantify the return on structured coaching and identify where the gap between evidence and practice is largest.
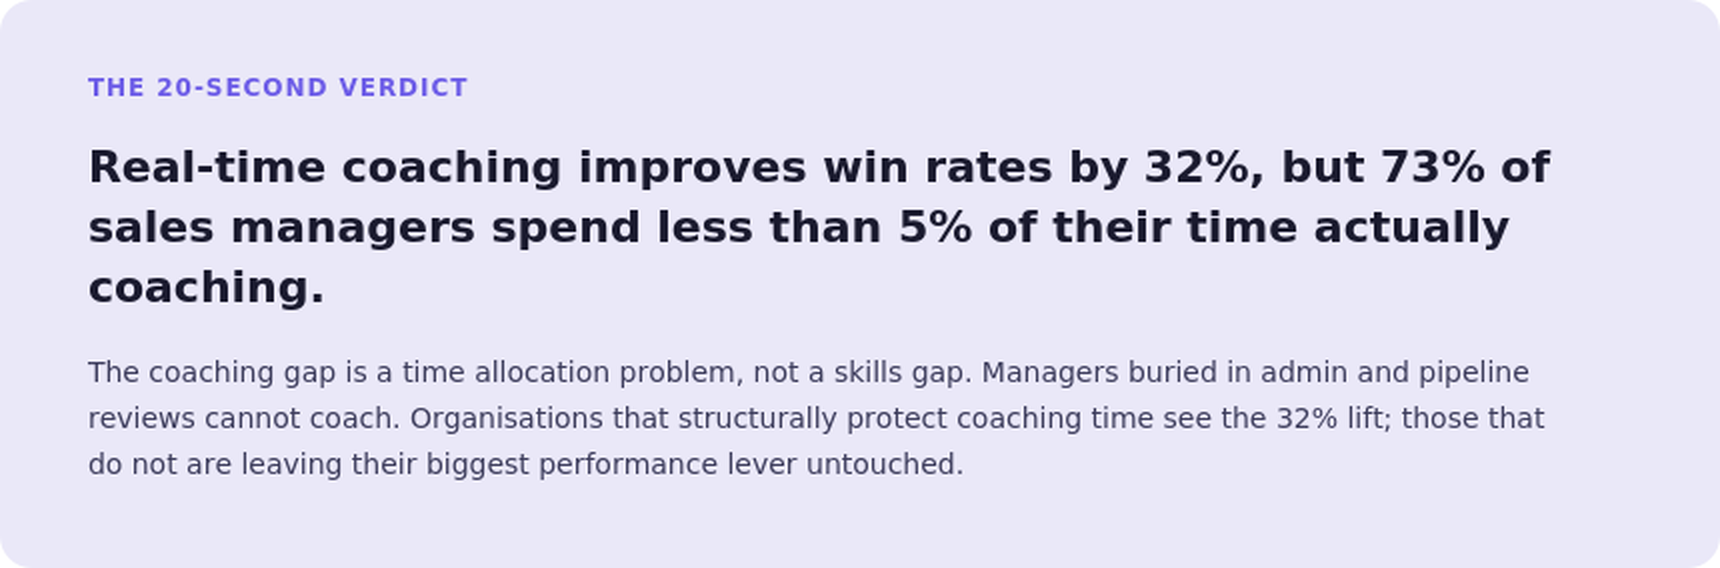
54. Dynamic, real-time coaching improves win rates by 32.1% and quota attainment by 27.9%. (CSO Insights, Sales Coaching Research 2025)
The distinction between generic coaching and deal-specific, real-time coaching is significant. Coaching that addresses the live deal in front of the rep, not theoretical frameworks, is where the performance lift concentrates.
55. 73% of sales managers spend less than 5% of their time actively coaching their teams. (CSO Insights, Sales Management Report 2024)
The coaching gap is a management time allocation problem, not a skills problem. Managers who are in the field, selling or buried in admin cannot coach effectively. Structural changes to role design are required to close the gap.
56. Companies providing real-time, deal-specific coaching see 8.4% higher year-over-year revenue growth. (CSO Insights, Sales Coaching Research 2025)
The compounding effect of consistent coaching on revenue growth is one of the strongest ROI cases in sales operations. An 8.4% YoY growth premium, sustained over three years, produces a materially different revenue trajectory.
57. Quality coaching improves the performance of middle-tier sellers by up to 19%. (RAIN Group, Sales Coaching Research 2025)
The highest-return coaching investment targets the middle 60% of the sales team, not the top 10% or the bottom 10%. Top performers are already performing; bottom performers often need role reassessment. The middle tier has the most improvable capacity.
58. Sales training delivers an average ROI of $4.53 per dollar invested, a 353% return. (Association for Talent Development, Sales Training ROI Study 2024)
Training ROI is highest when delivered in the context of current deals and reinforced with coaching within 72 hours of the training session. Standalone workshops without reinforcement deliver a fraction of this return.
59. Teams forget 84% of sales training content within three months without reinforcement. (Ebbinghaus Forgetting Curve, applied research via CSO Insights 2024)
This is the forgetting curve problem applied to sales training. It is not an indictment of training as a function; it is a structural argument for spacing repetition, in-context practice, and manager reinforcement between training events.
60. Organisations with high-effectiveness training programmes have 33.8% turnover versus 45.5% at low-effectiveness organisations. (RAIN Group, Sales Training Effectiveness Report 2025)
Turnover is both a consequence and a cause of poor training. Reps who feel underprepared leave; their departure loads more pressure onto remaining reps who are also under-trained. Effective training is a retention investment as much as a performance one.
61. Continuous training programmes lead to 50% higher net sales per representative. (Carew International, cited in RAIN Group 2025)
The productivity gap between reps who receive ongoing development and those who receive only onboarding training widens over time. Continuous training is not an overhead; it is a compounding asset.
Sales productivity statistics
Sales productivity measures how efficiently reps convert time into revenue. The benchmarks below reveal a consistent finding: most sales reps spend a minority of their time actually selling. Closing that gap is the highest-return operational opportunity most organisations have.
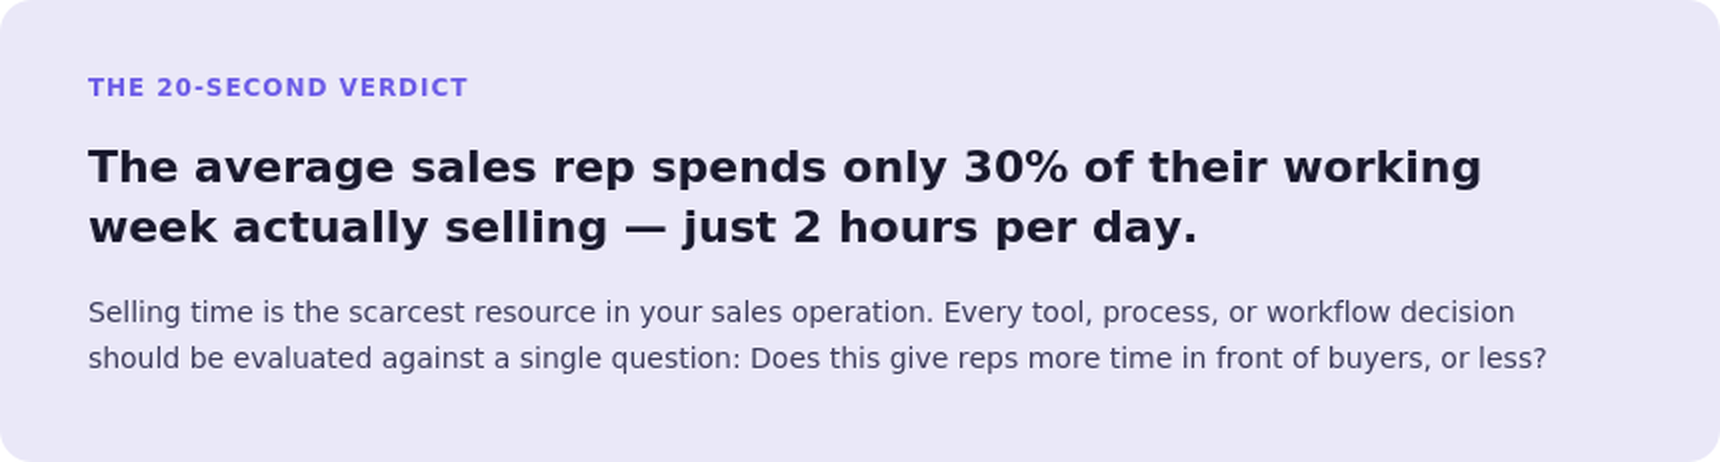
62. The average sales rep spends only 30% of their working week on direct selling activities. (HubSpot, State of Sales 2026)
With 70% of a rep's time consumed by admin, CRM data entry, content search, internal meetings, and non-selling activities, even modest improvements to time allocation produce measurable revenue impact.
63. Sales reps spend an average of only 2 hours per day on actual sales activities. (HubSpot, Sales Productivity Research 2025)
Two hours of selling time per day is the industry benchmark — and it is the floor, not the target. Tools that eliminate manual data entry, automate follow-up, and reduce content search time directly expand this number.
64. Top performers spend 18% more time updating their CRM than average performers. (LinkedIn, State of Sales Report 2025)
This is counterintuitive but consistent in the data. Top performers treat CRM data quality as a selling asset; it gives them better context, cleaner forecasting, and more accurate deal prioritisation.
65. 29% of sales professionals say reducing their technology stack would make them more efficient. (HubSpot, Sales Technology Survey 2025)
Tool overload is a real productivity drag. More technology does not equal more productivity. A smaller, better-integrated stack, where data flows between tools without manual re-entry, outperforms a complex multi-tool environment.
66. Sales reps spend approximately 15% of their time leaving voicemails. (RingDNA, Sales Productivity Benchmark 2024)
Voicemail strategy is worth optimising. Pre-recorded, personalised voicemail drops that can be sent in one click, rather than re-recorded every time, recover this time without sacrificing outreach quality.
67. Email sequences of 4–7 messages achieve a 27% reply rate, versus 9% for sequences of 1–3 messages. (HubSpot, Email Outreach Report 2025)
Persistence within a sequence pays. Single-touch email outreach is almost universally insufficient. The data support a minimum of four touches before a non-response is classified as disengaged.
68. The first follow-up email in a sequence increases response rate by 49%. (Yesware, Email Response Rate Research 2025)
The follow-up is often more valuable than the original outreach. The first message establishes the context; the follow-up catches the prospect at a different moment in their day, week, or buying cycle.
69. Email marketing generates $36 for every $1 invested — the highest ROI of any sales outreach channel. (Litmus, State of Email 2025)
Interpreted in a sales context, this ROI reflects well-targeted, personalised sequences rather than blast emails. Relevance drives the return; volume without targeting drives unsubscribes.
70. Sales reps who limit their technology to three or fewer integrated tools report the highest productivity scores. (HubSpot, Sales Technology Survey 2025)
The three-tool ceiling is a practical guideline: CRM, email/calendar integration, and one prospecting or engagement tool. Beyond three, the context-switching cost exceeds the productivity benefit of the additional capability.
CRM and technology statistics
CRM adoption has crossed into near-universal territory for companies above a threshold size. The differentiator is no longer whether a team uses a CRM; it is how deeply they use it, how clean their data is, and whether it surfaces the signals that drive next actions.
71. 91% of companies with 10 or more employees use a CRM system. (Grand View Research, CRM Market Analysis 2025)
CRM is infrastructure. The adoption question has been answered. The performance question, how effectively is the CRM being used to drive selling behaviour, is where meaningful differentiation now lives.
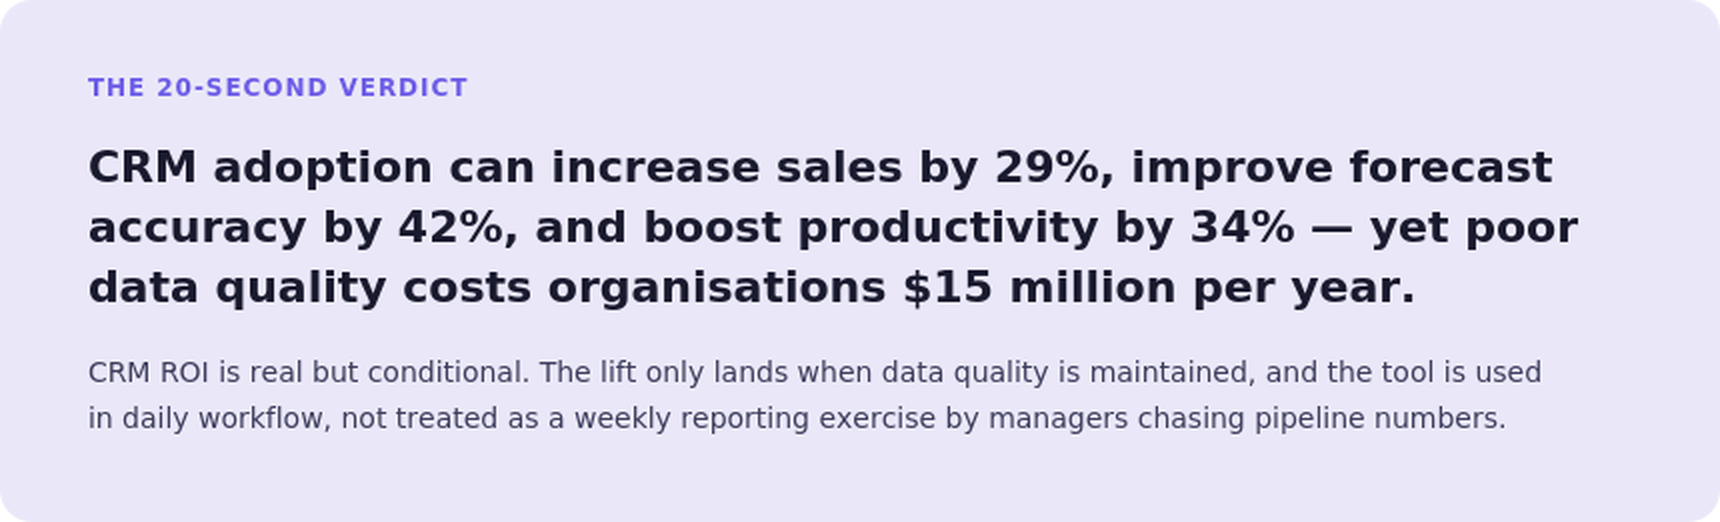
72. CRM adoption can increase sales by 29%, improve sales forecast accuracy by 42%, and improve sales productivity by 34%. (Salesforce, CRM ROI Research 2025)
These three metrics, revenue, forecast accuracy, and productivity, form the core CRM ROI case. The lift is only realised when CRM data quality is maintained, and the tool is embedded in daily workflow, not used as an end-of-week reporting exercise.
73. Companies using CRM see an average return of $8.71 for every $1 invested. (Nucleus Research, CRM ROI Report 2024)
The ROI figure is a blended average across company sizes and CRM maturity levels. Organisations with high adoption, clean data, and workflow integration consistently report returns above this benchmark.
74. Mobile CRM use increases sales rep productivity by 26.4% on average. (Nucleus Research, Mobile CRM Productivity Study 2024)
The productivity lift from mobile access reflects the reduction in post-visit data entry delay. Reps who log call notes and update deal status immediately after a meeting — rather than at the end of the day — maintain higher data quality and miss fewer follow-up triggers.
75. Poor CRM data quality costs organisations an average of $15 million per year. (Gartner, Data Quality Market Survey 2024)
Data quality loss is diffuse and difficult to attribute to a single failure — it shows up as missed follow-ups, inaccurate forecasting, and reps working accounts that have already churned. The cost is real but invisible until someone measures it.
76. Sales teams that automate CRM data entry through AI see a 40% reduction in administrative burden. (Salesforce, State of Sales 2026)
Automatic call logging, email sync, and meeting note capture eliminate the manual entry that sits between a sales conversation and an accurate CRM record. The elimination of this lag has downstream benefits for forecast quality and rep follow-up timing.
77. Only 62% of field sales teams use a CRM, despite CRM being the single highest-ROI technology category. (SPOTIO, State of Field Sales 2026)
Field sales adoption lags inside sales adoption significantly. The barrier is typically a CRM designed for desk-based workflows that breaks down in mobile, offline, or between-appointment contexts.
Sales compensation and quota statistics
Compensation structures drive behaviour. When the wrong activities are rewarded, or when quota targets are structurally unattainable, the downstream effects show up in attrition, disengagement, and revenue underperformance.
78. 86% of sales reps rank compensation as the single most important factor when evaluating a job. (LinkedIn, Talent Solutions: Sales Compensation Report 2025)
For sales hiring and retention, compensation is the primary lever. Non-monetary benefits, culture, and development opportunities matter, but they operate as differentiators within a compensation range that meets threshold expectations, not substitutes for it.
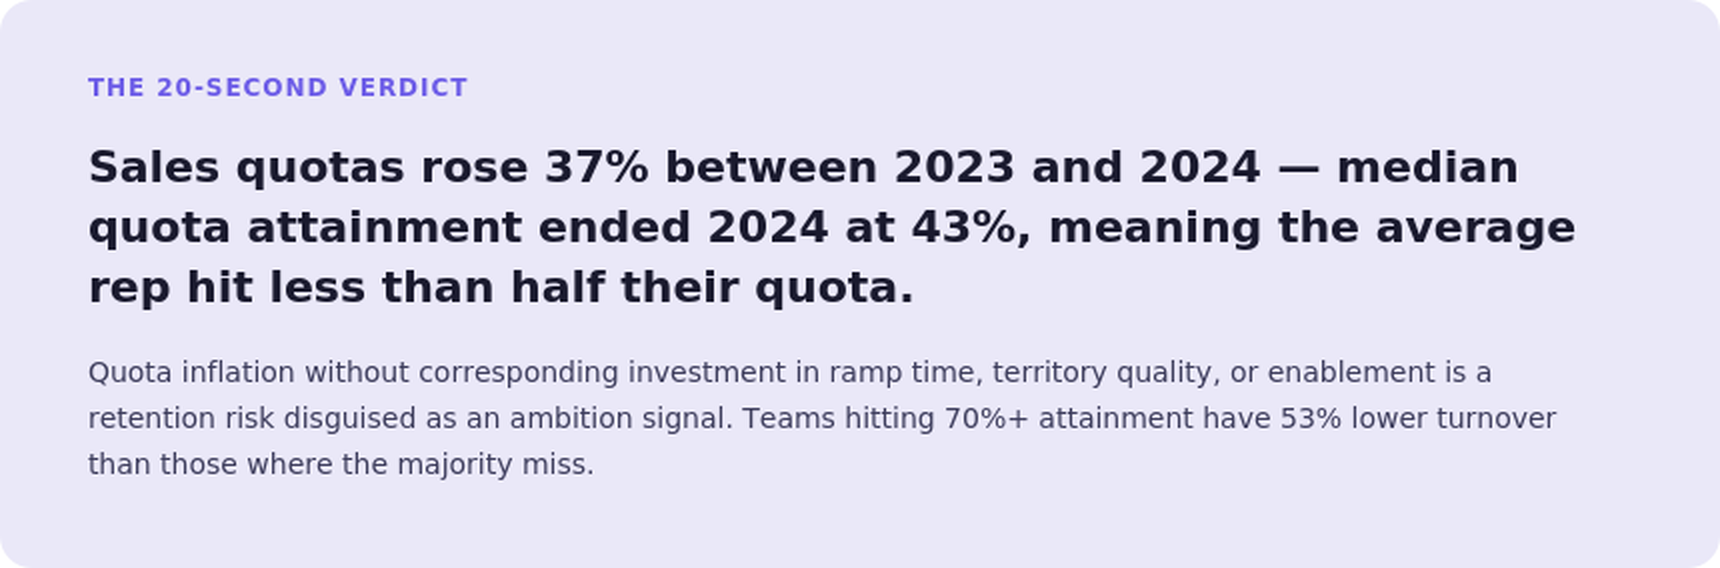
79. Sales quotas increased an average of 37% between 2023 and 2024 — without a corresponding increase in support, tools, or territory quality. (SPOTIO, State of Field Sales 2026)
The quota inflation problem is structural: leadership raises targets in response to revenue pressure without adjusting the inputs — rep capacity, lead quality, territory coverage, or enablement, that would make higher targets achievable.
80. Teams that ended 2024 at an average quota attainment of 43.14%, meaning the median rep hit less than half their target. (RepVue, Annual Sales Index 2024)
A median attainment below 50% indicates that the quota-setting process is systematically disconnected from market reality. It also signals that compensation structures designed around 100% attainment are failing to pay fairly for performance that would be excellent in context.
81. Pay-for-performance models that tie compensation to specific pipeline metrics, not just closed revenue, show 17% higher rep engagement scores. (WorldatWork, Sales Compensation Research 2025)
Activity-based components in compensation design acknowledge that reps cannot control all the variables between pipeline creation and a closed deal. Rewarding the leading indicators, qualified meetings, opportunities created, reduces the distortion caused by factors outside the rep's control.
82. Companies that include profitability measures in sales compensation see a 12% improvement in gross margin per deal. (Alexander Group, Sales Compensation Trends 2025)
Revenue targets alone incentivise discounting. Adding margin-based components to compensation aligns rep behaviour with business economics rather than pure volume.
83. Sales teams with quota attainment above 70% report 53% lower annual turnover than teams where the majority of reps miss quota. (SPOTIO, State of Field Sales 2026)
Attainment and attrition are tightly correlated. Reps who consistently miss quota, particularly when the miss is driven by quota design rather than performance, leave. Their departure triggers a cycle of ramp time, reduced capacity, and further quota pressure on remaining team members.
Social selling and email statistics
Social selling and email remain the two highest-volume B2B outreach channels. These benchmarks cover LinkedIn prospecting effectiveness, email performance by format, and the compounding impact of combining channels.
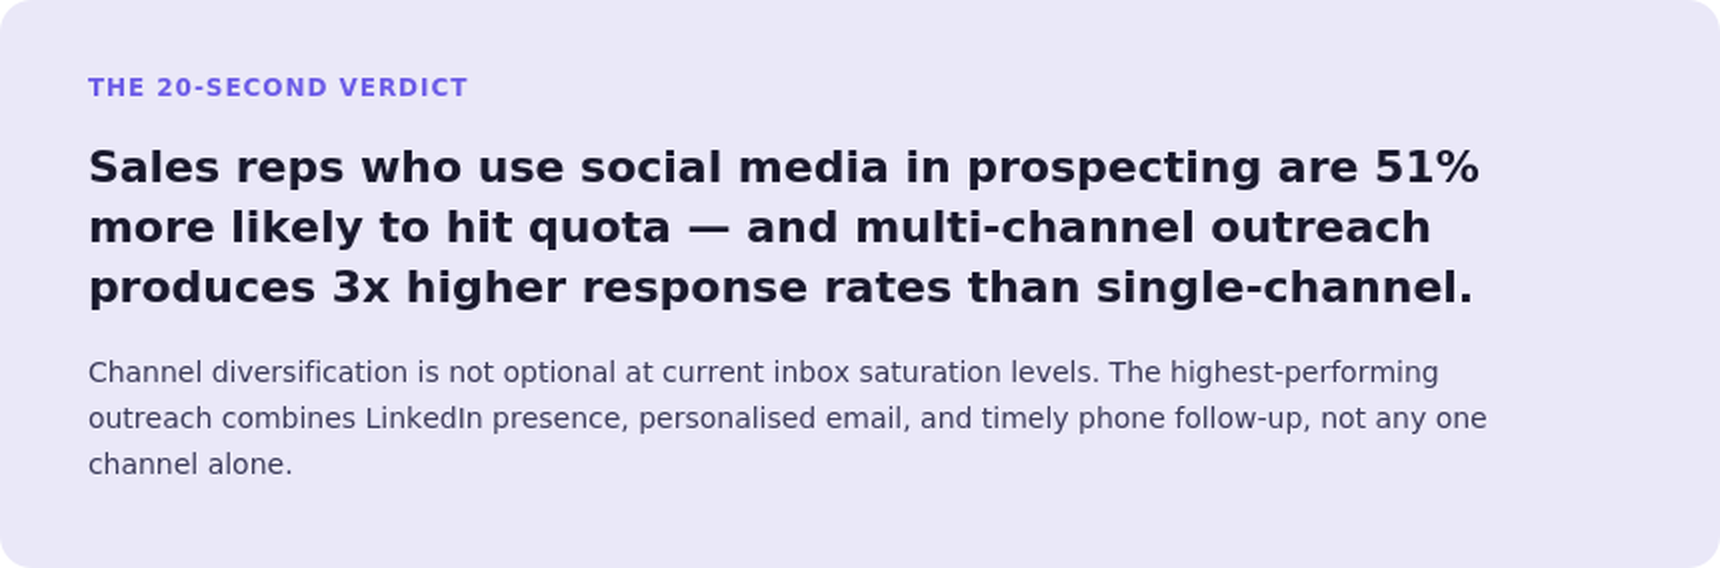
84. Salespeople who use social media in their prospecting process are 51% more likely to hit quota. (LinkedIn, State of Sales Report 2025)
Social selling is not a replacement for direct outreach; it is a signal amplifier. Engaging with a prospect's content before reaching out directly warms cold outreach and reduces the probability of being ignored.
85. 78% of social sellers outperform peers who do not use social media as part of their sales process. (LinkedIn, State of Sales Report 2025)
The social selling advantage accrues primarily through LinkedIn, the only social platform where professional identity, company role, and current business priorities are explicitly stated and publicly visible.
86. Personalised email subject lines increase open rates by 50%. (HubSpot, Email Performance Benchmark 2025)
Personalisation in subject lines means relevance signals — the prospect's company name, recent news, or shared context, not just name insertion. Name-only personalisation produces diminishing returns as buyers become desensitised to the technique.
87. The average B2B email open rate is 19.7%; smaller prospect lists (under 200) generate 10% more replies than large-list approaches. (HubSpot, Sales Email Benchmark 2025)
Targeted, smaller-list outreach outperforms volume approaches on reply rate. The trade-off is throughput; this is the argument for building highly qualified lists rather than maximising send volume.
88. Multi-channel outreach, combining email, LinkedIn, and phone, produces 3x higher response rates than single-channel approaches. (SalesLoft, State of Sales Engagement 2025)
Channel redundancy ensures the message reaches the prospect through whichever medium they check most frequently. A prospect who ignores email may respond to a LinkedIn message that appeared the same day.
General sales trend statistics
These headline statistics frame the macro environment in which the numbers above sit. They provide the strategic context for understanding where individual-level performance data fits within the broader picture of market conditions in 2026.
89. 79% of sales leaders report higher revenue year-over-year, while 67% of individual reps doubt they will hit their targets. (Salesforce, State of Sales 2026)
The organisational-to-individual gap is the defining paradox of the current sales environment. Company revenue can grow while rep quota attainment falls — when growth concentrates in the top performers and large-account retention, while the majority of the team underperforms.
90. 81% of sales teams that use AI tools reported revenue growth last year. (Salesforce, State of Sales 2026)
The correlation between AI tool usage and revenue growth is now the strongest predictor in the State of Sales data. Causation is directional but not clean; teams that invest in AI tools also tend to invest more broadly in enablement and process.
91. Gartner projects that 80% of B2B sales interactions between suppliers and buyers will occur through digital channels by 2025. (Gartner, Future of Sales 2025)
This projection, now largely validated, signals the end of in-person selling as the primary commercial motion for B2B. Sales organisations built around field visits and event-based relationship development need structural adaptation, not tactical adjustment.
92. The subscription economy is projected to reach USD 1.5 trillion by the end of 2025, up 435% over nine years. (UBS, Global Subscription Economy Report 2025)
Recurring revenue is now the dominant commercial model across software, media, services, and increasingly, physical products. Sales motions built for one-time transaction models need restructuring for an environment where retention matters as much as acquisition.
93. 53% of sales teams cite economic conditions as the primary reason for missing quota. (Salesforce, State of Sales 2025)
Macro attribution is the most common explanation for quota misses, and the most difficult to act on. The practical response is not to wait for conditions to improve but to adjust ICP criteria, deal stage definitions, and quota structure to match the environment.
94. B2B companies expect 15% partner-driven growth in 2026, more than the overall industry growth rate. (Salesforce, State of Sales 2026)
Partner and channel revenue is outperforming direct sales growth. Organisations without a formalised partner programme are leaving a measurable share of achievable growth on the table.
95. 86% of buyers avoid businesses they do not trust. (Salesforce, State of the Connected Customer 2025)
Trust is not a soft metric — it is a binary buying criterion. Transparency around pricing, honest qualification conversations, and consistent follow-through are the behaviours that build it.
96. 70% of business leaders say subscription and recurring revenue models are vital to their future. (Zuora, Subscription Economy Index 2026)
Leadership-level conviction about recurring revenue models has crossed into consensus. The operational question is how to restructure sales compensation, quota design, and pipeline metrics to support a retention-heavy commercial model.
Sales data quality statistics
The quality of data feeding into sales decisions is often the invisible bottleneck. These statistics cover how data gaps, siloed systems, and security concerns affect sales performance, and why data hygiene has become a board-level concern.
97. 84% of data and analytics leaders agree that AI outputs are only as good as the data inputs they are given. (Source: Salesforce, Data analytics trends 2026)
Garbage-in, garbage-out is the foundational data quality principle. In a sales context, this means AI-assisted lead scoring, deal health monitoring, and next-action generation are only as reliable as the CRM data quality that feeds them.
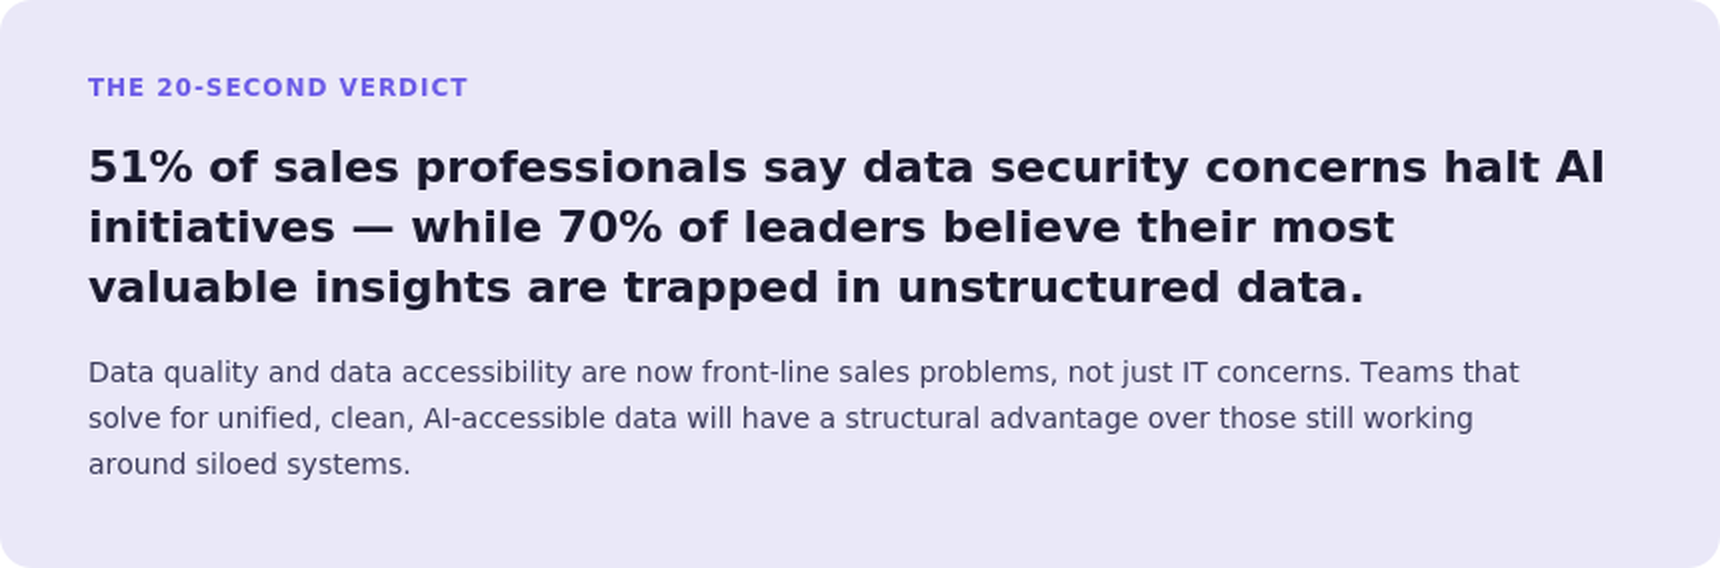
98. 70% of data and analytics leaders believe the most valuable insights for their organisation are trapped in unstructured data. (Source: Salesforce, Data analytics trends 2026)
Unstructured data email threads, call transcripts, PDF contracts, and meeting notes- contain the highest-signal buyer context. AI tools that can parse and surface this data for CRM use are addressing one of the most significant data accessibility gaps in the current stack.
99. 87% of data and analytics leaders believe unified data is key to meeting customer expectations. (Source: Salesforce, Sales Statistics Report)
Unified data means a single customer record that combines CRM data, product usage, support history, and marketing engagement. The alternative, siloed data in separate tools, produces an incomplete picture that leads to misaligned outreach and missed signals.
100. Sales leaders estimate that 19% of their company's data is inaccessible, limiting visibility and personalisation. (Source: Salesforce, Sales Statistics Report)
Inaccessible data is lost in the pipeline before it is created. When reps cannot see the full context of an account, past interactions, open support tickets, and product usage, they sell with a partial picture.
101. 51% of sales professionals say data security concerns halt or delay AI initiative rollouts. (Source: Salesforce, Sales Statistics Report)
Security concerns are a real inhibitor of AI adoption, particularly in regulated industries. The resolution is an AI tool with built-in data governance, purpose-built security controls that allow teams to leverage customer data for insights without creating compliance risk.
Resources & references
• Salesforce State of Sales 2026 — AI adoption benchmarks and sales performance data across 4,000+ professionals.
• Salesforce State of the Connected Customer 2025 — B2C customer experience and trust research.
• HubSpot State of Sales 2025 / 2026 — Sales productivity, prospecting, and quota attainment statistics.
• LinkedIn State of Sales Report 2025 — Social selling performance and B2B rep behaviour data.
• Gartner — The New B2B Buying Journey — B2B buyer committee size, digital channel adoption, and deal complexity research.
• Forrester — B2B Marketing and Sales Predictions 2025 — Lead nurturing ROI and sales productivity benchmarks.
• McKinsey — The State of AI in Sales 2025 — AI adoption impact on sales productivity and administrative burden.
• SPOTIO — State of Field Sales 2026 — Field sales quota attainment, CRM adoption, and compensation benchmarks.
• RAIN Group — Sales Prospecting and Coaching Research 2025 — Top performer behaviour and coaching ROI data.
• CSO Insights — Sales Enablement and Coaching Research — Win rate lift and coaching time allocation benchmarks.
• Gong Labs — Revenue Intelligence Report 2025 — Conversation intelligence data on call duration, multi-threading, and deal health.
• SalesLoft — State of Sales Engagement 2025 — Outreach sequence reply rates and multi-channel engagement benchmarks.
• Nucleus Research — CRM ROI Studies 2024 — CRM return on investment and mobile CRM productivity data.
• PwC — Future of Customer Experience Survey 2025 — B2C buyer willingness to pay for experience and churn triggers.
• Zuora — Subscription Economy Index 2026 — Subscription model growth projections and recurring revenue trends.
• Association for Talent Development — Sales Training ROI Study 2024 — Training ROI, knowledge retention, and rep productivity benchmarks.
• RepVue — Annual Sales Index 2024 — Quota attainment rates and compensation data across sales roles.
• Forrester — Lead Nurturing Benchmarks — Nurtured lead conversion rates and pipeline cost data.

Frequently Asked Questions (FAQs)
Related Articles

12 Apr, 2025
Sales CRM: Comparison on Features, Pricing, and Suitability

25 May, 2026
12 best sales methodologies for high-performing teams in 2026

11 Jun, 2026